
Figure 2. miR-21 is required for efferocytosis induced suppression of pro-inflammatory TNFα expression.
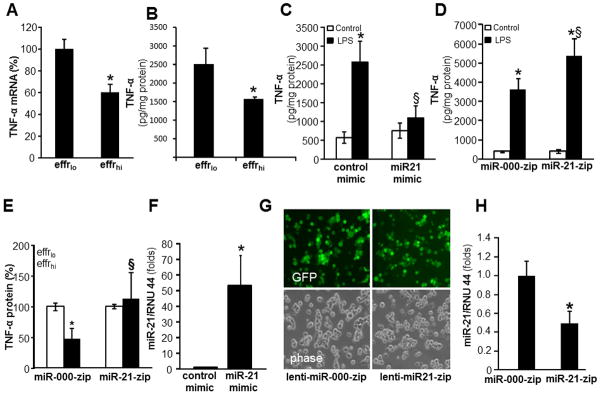
A–B, For efferocytosis assay, blood monocyte derived macrophages (MDM) were co-cultured either viable (effrlo) or apoptotic (effrhi) Jurkat T cells for 1h. Non-efferocytosed cells were removed by washing with saline. Cells were treated with LPS (1ug/ml) for 6h (mRNA) or 24h (protein) post efferocytosis. TNFα A, mRNA and B, protein expression were measured using quantitative PCR and ELISA, respectively. Data are mean ±SD (n = 4); *, p<0.05 compared to macrophage cultured with effrlo group. C, MDM were transfected with miRIDIAN hsa-miR-21 mimic or control-mimic to increase miR-21 levels. Cells were activated with LPS (1ug/ml) for 24h after forced expression of miR-21 in MDM. The TNFα protein levels in cells were determined using ELISA. Data are mean ±SD (n = 4); *, p<0.05 compared to macrophage cultured with control-mimic group. §, p<0.05 compared to control-mimic LPS treated group. D, Stable knock down of miR-21 in THP-1 monocytic cells was achieved following lentiviral transduction with lenti-miR-000-zip or lenti-miR-21-zip vectors and puromycin selection. The THP-1 cells with stable knockdown of miR-21 were cultured and differentiated to macrophages with phorbol-12-myristate-13-acetate (PMA, 20 ng/ml, 48h). Cells were activated with LPS (1ug/ml) for 24h. TNFα protein released by the cells in culture media was determined using ELISA. Data are mean ±SD (n = 4); *, p<0.05 compared to macrophage cultured with miR-000-zip (control) group. §, p<0.05 compared to miR-000-zip LPS treated group. E, Loss of miR-21 in macrophages result in abrogation of efferocytosis mediated suppression of LPS-induced TNFα expression. MiR-000-zip or miR-21-zip cells were subjected to efferocytosis followed by treatment with LPS for 24h. TNFα protein levels in cells were determined using ELISA. Data are mean ±SD (n = 4); *, p<0.05 compared to macrophage cultured with effrlo group. §, p0.05 compared to miR-000-zip cells. F, miR-21 expression in miRIDIAN hsa-miR-21 mimic or control-mimic transfected cells. Data are mean ±SD (n = 4); *, p<0.05 compared to macrophage cultured with control-mimic cells. G, GFP (green) and phase contrast (phase) images of THP-1 cells showing transduction efficiency following lentiviral transduction with lenti-mi-000-zip or lenti-miR-21-zip vectors and puromycin selection showing over 80% cells were GFP positive. H, miR-21 expression in lenti-miR-000-zip or lenti-miR-21-zip cells. Data are mean ±SD (n = 4); *, p<0.05 compared to macrophage cultured with miR-000-zip cells.