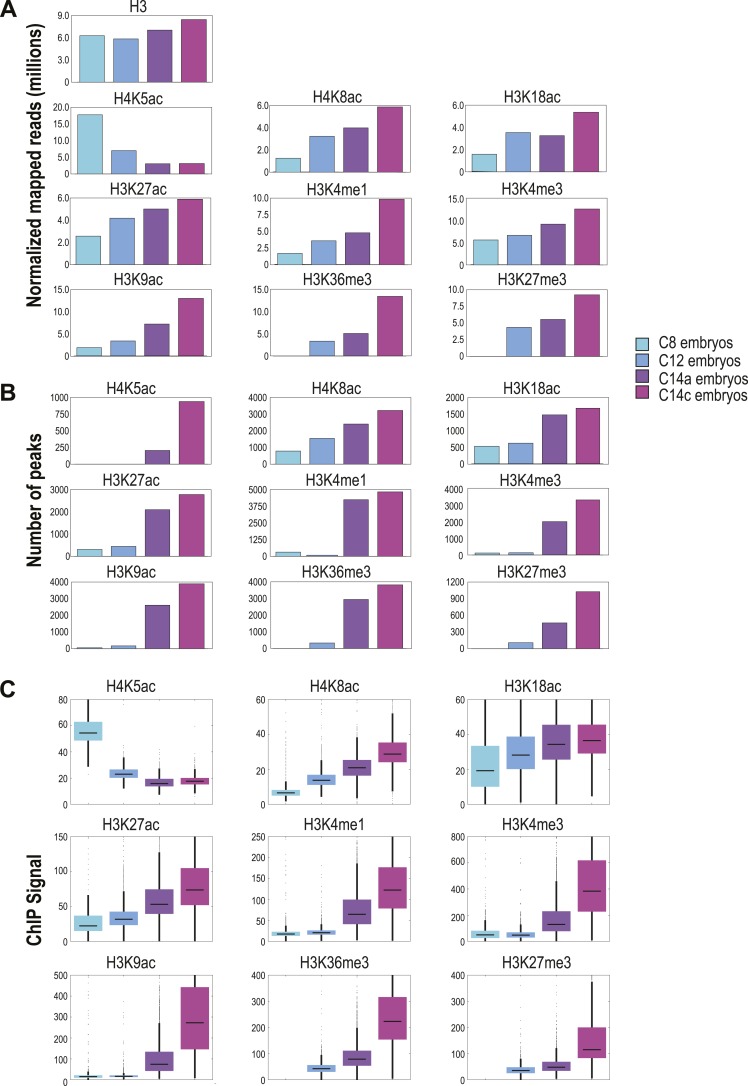
Figure 2. Global levels of histone marks change over early development.
(A) The number of aligned reads (after normalization to D. pseudoobscura) for the four developmental time points are indicated for each histone mark and histone H3. (B) The number of peaks detected using the peak calling program, MACS (Zhang Y et al., 2008), for each histone mark at each stage are shown. (C) Box plots show the trend of average ChIP-seq signals over ±500 bp around the peaks detected across all stages for each histone mark. The dark line in the middle of the plot represents the median, the edges of the box represent the first and third quartiles.

