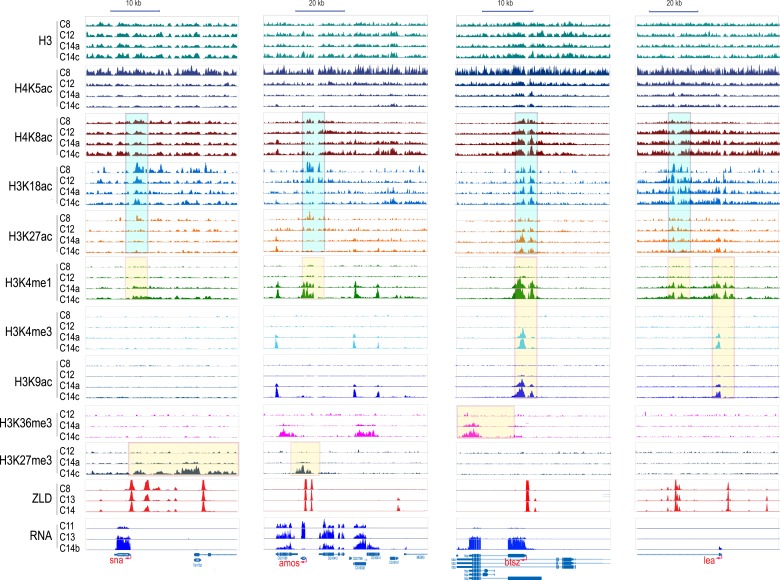
Figure 3. Dynamics of H3 and histone marks around selected genes.
The normalized ChIP-seq signal profiles, for histone H3 and nine different histone marks at four development time points at selected genomic loci. Shown are the early onset genes, sna and amos, and late onset genes, btsz and lea. The peak regions of histone acetylation marks detectable prior to MBT are highlighted with cyan-colored boxes. The peak regions for histone marks detected only after the MZT are highlighted by yellow-colored boxes. Below are the ZLD ChIP-seq profile (Harrison et al., 2011) from c8, 13, and 14 embryos, as well as RNA-seq signals (Lott et al., 2011) at c11, c13, c14b.

