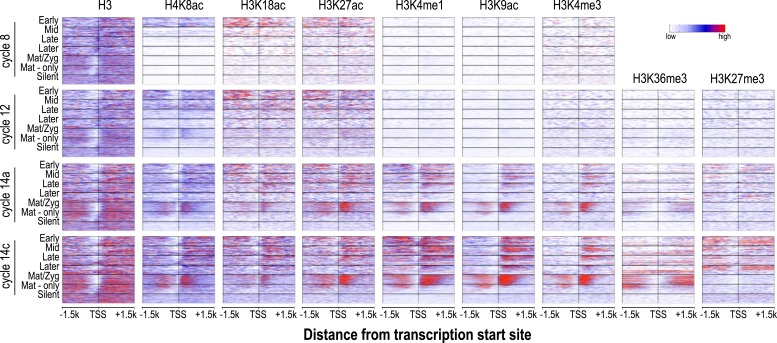
Figure 5. Relationship between H3 depletion, histone modifications and transcription dynamics.
Heatmaps show ChIP-seq signals for histone H3 and different histone modification marks at each stage centered around the transcription start sites (±1.5 kb). Genes are groups and ordered as described in Figure 4. For each histone mark and for histone H3 the same color scaling was used for heatmaps across all four developmental time points. TSS = transcriptional start site.

