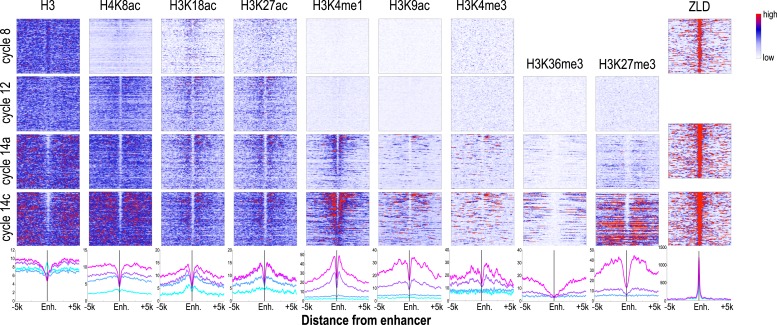
Figure 6. Dynamics of histone H3 depletion and histone modifications around blastoderm embryo enhancers.
Heatmaps show ChIP-seq signals for histone H3 and different histone modification marks at each stage centered around putative enhancers (as described in text). Enhancers are ordered by chromatin accessibility, as measured by DNaseI–seq signals from cycle 14 embryos (Thomas et al., 2011) from high (top) to low (bottom). On the right, the heatmaps show the ChIP-seq signals for ZLD binding around these enhancers at c8, c13, and c14 (Harrison et al., 2011). Line plots at the bottom show the average ChIP-seq for histone H3, histone modifications, and ZLD at each stage around the enhancers. Enh. = enhancer.

