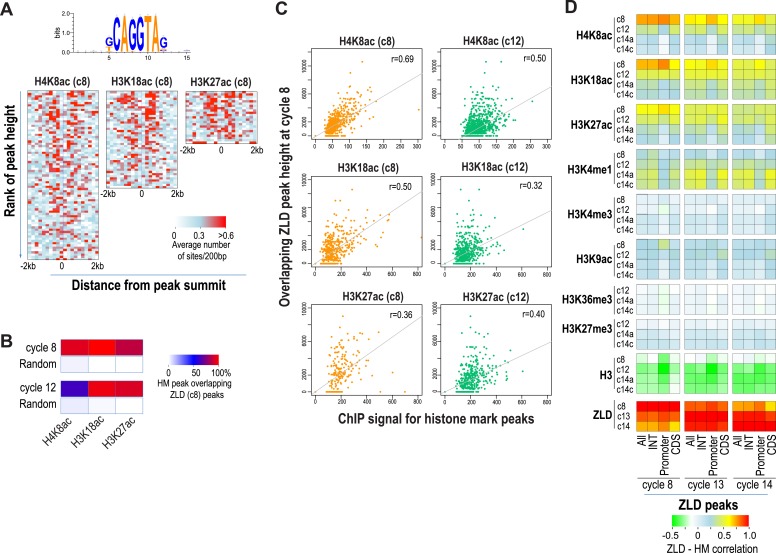
Figure 7. Relationship between histone occupancy, histone modification pattern and ZLD binding.
(A) ZLD DNA binding motif enrichment around cycle 8 peaks for H4K8ac, H3K18ac, and H3K27ac. Peaks were ranked based on peak height, divided into bins of 100, and analyzed. Heatmaps show, for each location (column) and set of peaks (row), the average number of ZLD putative sites at each position/set. (B) Heatmap showing the overlap between histone acetylation peaks detected at cycle 8 and 12, a.nd ZLD peaks detected at cycle 8 (top 2000 ranked peaks). As a control, overlaps between histone mark peaks with random set of genomic positions that matched the number of ZLD peaks are shown. (C) Scatter plots showing the correlation between the signals around the peaks for the histone acetylation marks at cycle 8 and cycle 12 (X-axis) and the heights of the associated ZLD peaks within 1 kb of the histone mark peaks (Y-axis). The signal for each peak was the average over the ±1 kb region surrounding the peak. The correlation coefficient (r) for each plot is shown. (D) Heatmaps showing Pearson correlation coefficients between ChIP signal of top 5000 ZLD peaks and histone marks at same locations. ChIP-seq signals for histone H3 was averaged over a ±200 bp region around each ZLD peak. Histone marks were averaged over ±1 kb around ZLD peaks. The correlation coefficients were calculated individually for all the ZLD peaks (‘All’), for intergenic and intronic ZLD peaks (‘INT’), for promoter peaks (‘Promoter’), and for ZLD peaks within coding sequences (CDS).

