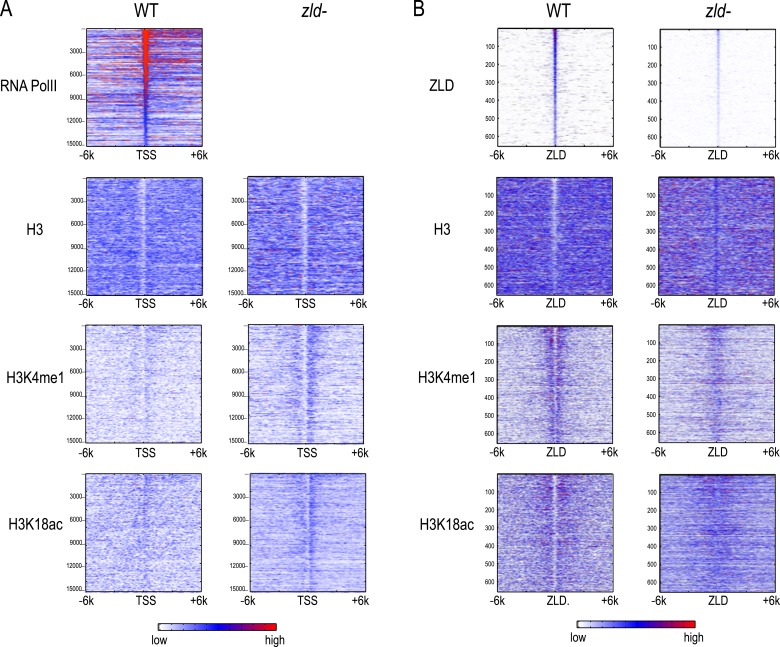
Figure 8. Effect of zld mutation on histone occupancy and modifications.
Heatmaps show ChIP-seq data from WT embryos (left) and embryos lacking maternal zld (right). (A) Heatmaps centered at transcription start sites (TSS) and ordered by cycle 14 RNA polymerase II binding. (B) Heatmaps centered around intergenic ZLD peaks (Harrison et al., 2011). Shown are all the intergenic and intronic peaks, among top 1000 ZLD bound regions (total of 656), ordered by ZLD ChIP signal and aligned by peak position. TSS, transcription start site.

