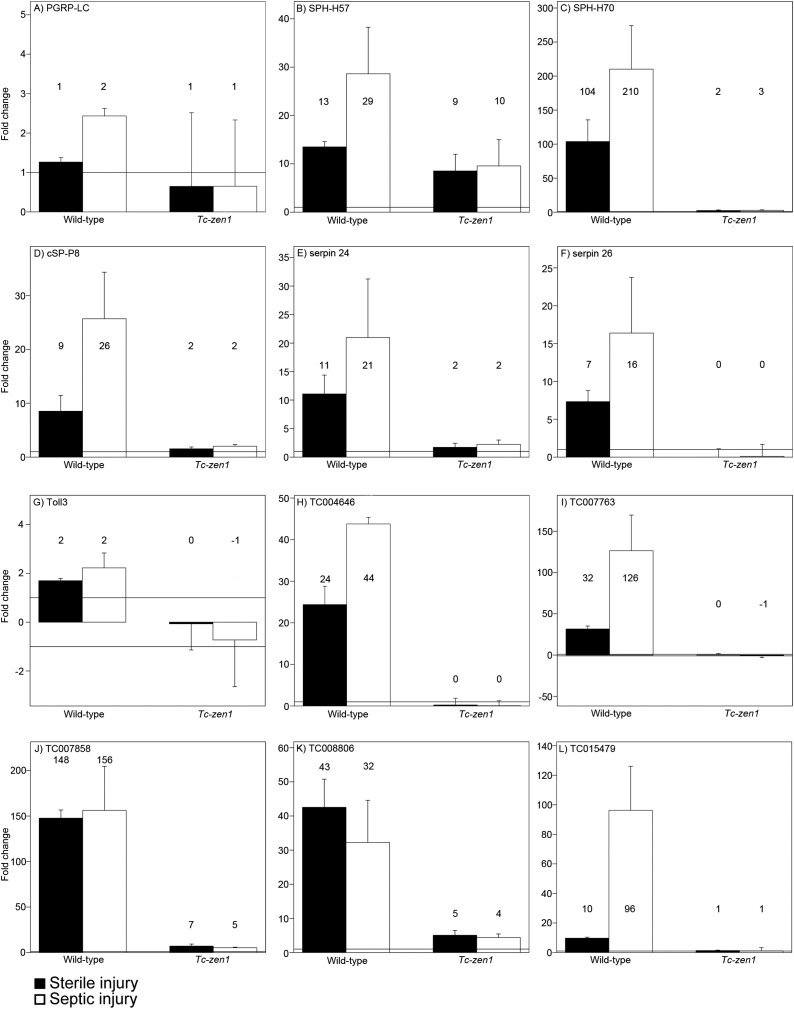
Figure 5. RT-qPCR verification of immune gene expression.
The expression levels of several immune genes was verified by RT-qPCR. Expression shown relative to the expression in naive eggs, the mean fold change of the biological replicates (based on two technical replicates) is plotted and error bars show the standard error. Black bars represent expression after sterile injury, white bars represent expression after septic injury. Expression levels measured by RT-qPCR show very similar results as the expression levels measured by RNAseq (See Supplementary file 2). (A) PGRP-LC, (B) SPH-H57, (C) SPH-H70, (D) cSP-P8, (E) serpin24, (F) serpin26, (G) toll3, (H) TC004646, (I) TC007763, (J) TC007858, (K) TC008806, (L) TC015479. See ‘Materials and methods’ for experimental details.

