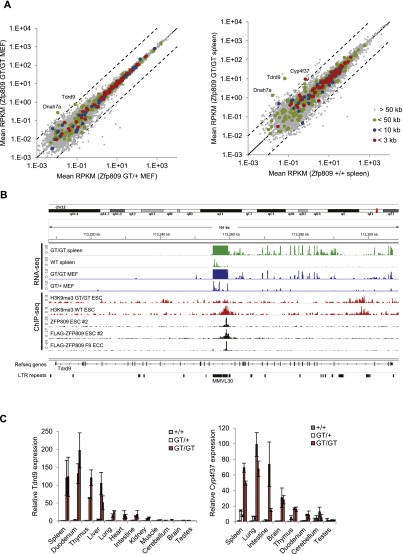
Figure 7.
ERVs repress host genes via ZFP809 recruitment. (A) Differential gene expression analysis of RefSeq genes in Zfp809GT MEFs (left panel) and spleens (right panel). RNA-seq RPKM values were determined for the exon proportion of RefSeq genes. Genes with TSSs that are located near strong Flag-ZFP809 ChIP-seq peaks are highlighted as indicated. Dotted lines mark 10-fold up-regulation and down-regulation. (B) RNA-seq and ChIP-seq read density at the Tdrd9 gene. (C) Tdrd9 (left) and Cyp4f37 (right) mRNA expression in somatic tissues and organs of male adult mice (9–12 wk old) measured by RT-qPCR (normalized to Hprt). For each genotype, two animals were analyzed. Values represent mean fold expression (n = 2 technical replicates) relative to wild-type mouse tissues.

