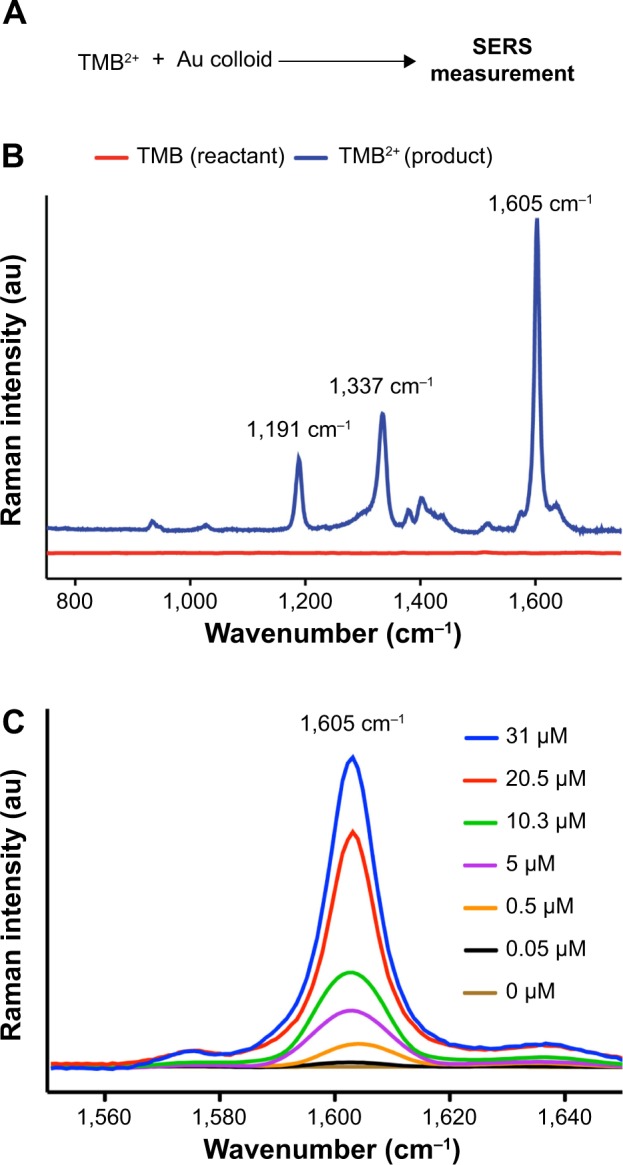
Figure 2.

(A) Scheme for SERS measurement. (B) Comparison of the SERS spectra for both reactant TMB and product TMB2+. (C) Hp concentration-dependent SERS spectra of TMB2+.
Abbreviations: SERS, surface-enhanced Raman spectroscopy; TMB, 3,3′,5,5′-tetramethylbenzidine; Hp, haptoglobin.
