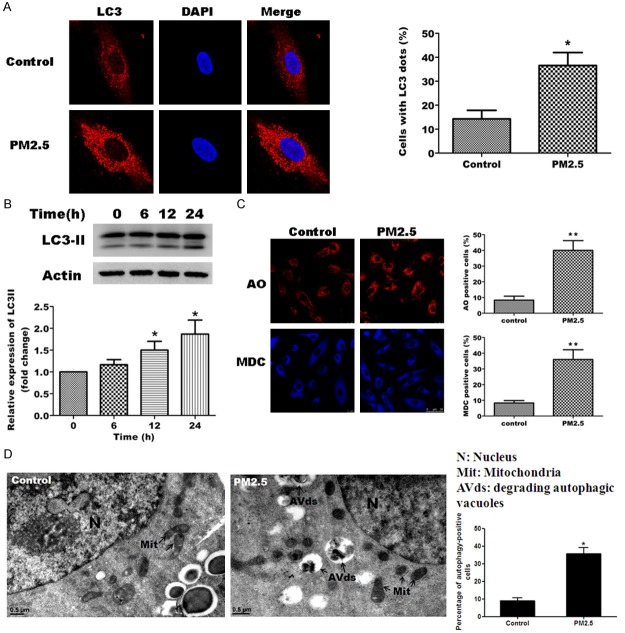
Figure 2.
PM2.5 induces autophagy in A549 cells. A, B. PM2.5 increases LC3B-II expression in A549 cells. A. A549 cells were left untreated (control) or were treated with 100 μg/ml PM2.5 for 24 h, and LC3 expression was assessed by immunofluorescence staining. DAPI staining of nuclei was performed as a background stain. A representative image is shown of the rather diffuse LC3 staining for the control cells and punctuates staining for the PM2.5 cells (left panel). Quantification of the number of cells with LC3 puncta was performed for > 100 cells from 3 independent experiments (right panel). B. Western blot of LC3 protein expression following treatment with 100 μg/ml PM2.5 for 0, 6, 12 and 24 h (left panel). Expression of LC3B-II was determined relative to actin and standardized to 1 in untreated cells (bottom panel). Results are representative of 3 independent experiments. C. PM2.5 increases autophagic vacuoles in A549 cells. Autophagic vacuoles were observed by Acridine orange (AO) and monodansylcadaverine (MDC) staining in untreated cells (control) or A549 cells treated with 100 μg/ml PM2.5 for 24 h. D. PM2.5 induces ultrastructural features of autophagy. A549 cells were treated with 100 µg/ml of PM2.5 for 24 h and processed for electron microscopy. Note the double membrane structure of the autophagic vacuoles. We indicate the presence of degrading autophagic vacuoles (AVds). N: Nucleus. Mit: Mitochondria. Bars 0.5 μm. Representative images are shown (right panel) and the mean ± SD of data from > 100 cells in 3 separate experiments (right panel). *p < 0.05, **p < 0.01, significant compared to controls.

