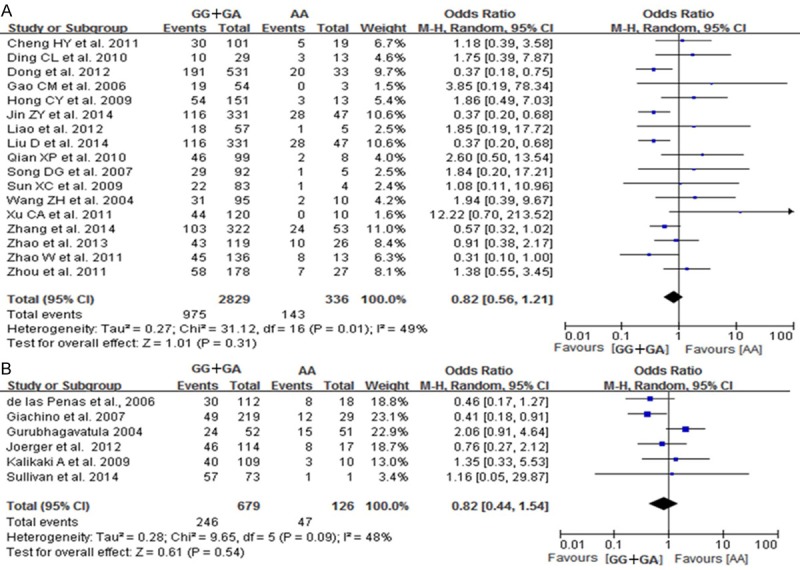
Figure 6.

Forest plot of Arg399Gln polymorphism of the XRCC1 gene and sensitivity to platinum-based drugs in non-small cell lung cancer, the horizontal lines correspond to the study-specific OR and 95% CI, respectively. The area of the squares reflects the study-specific weight. The diamond represents the pooled results of OR and 95% CI (AG+GG vs. AA). A: Chinese population; B: Caucasus population.
