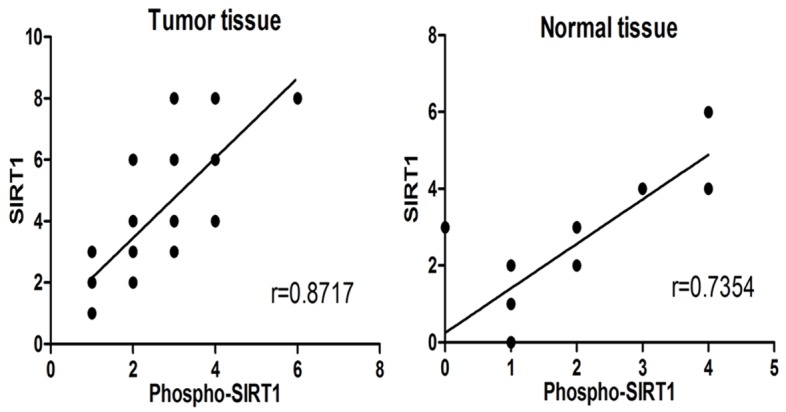
Figure 3.

Spearman correlation analysis was used to examine the expression correlation between Phospho-SIRT1 and SIRT1. Phospho-SIRT1 and SIRT1 had a highly positive correlation in both tumor tissues (r = 0.872) and normal tissues (r = 0.735). The ratios of Phospho-SIRT1 and SIRT1 expression in tumor tissues were higher than normal tissues.
