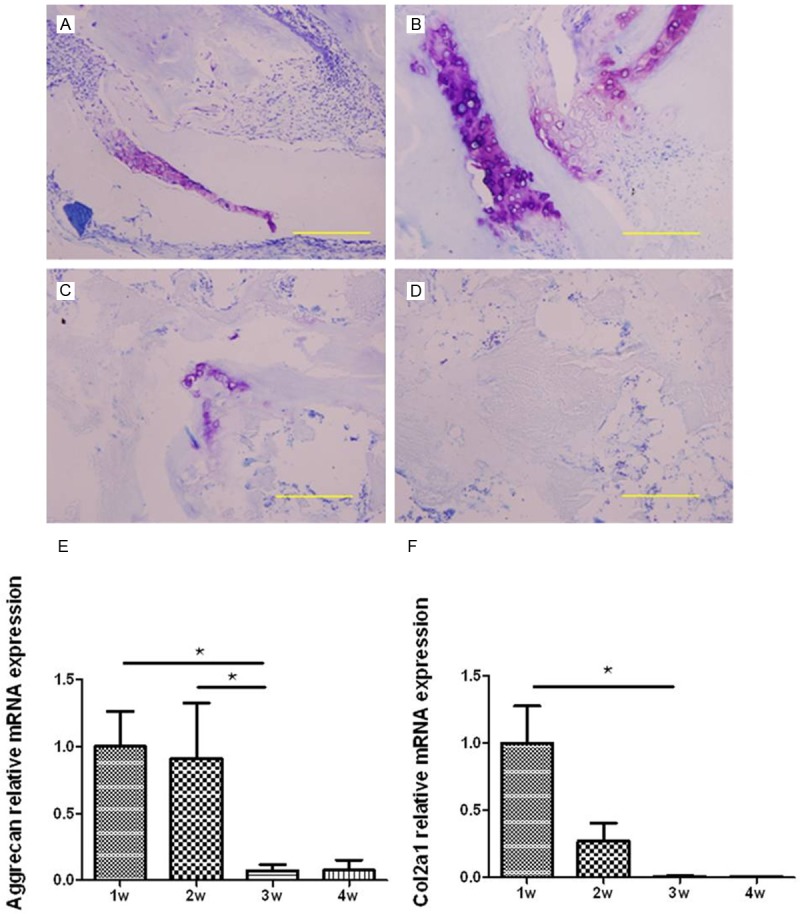
Figure 1.

The histology of BMG stained with toluidine blued at four time points and the expression of cartilage-specific genes. Representative images at different point of time: (A) 1 week, (B) 2 weeks, (C) 3 weeks and (D) 4 weeks (bar = 200 μm). Purple areas represent the typical cartilage extracellular matrix components. The relative expression level of Aggrecan and Col2a1 was evaluated by RT-qPCR (bar represents standard error of the mean). N = 6 for each time point, *represent P < 0.05.
