
Figure 3.
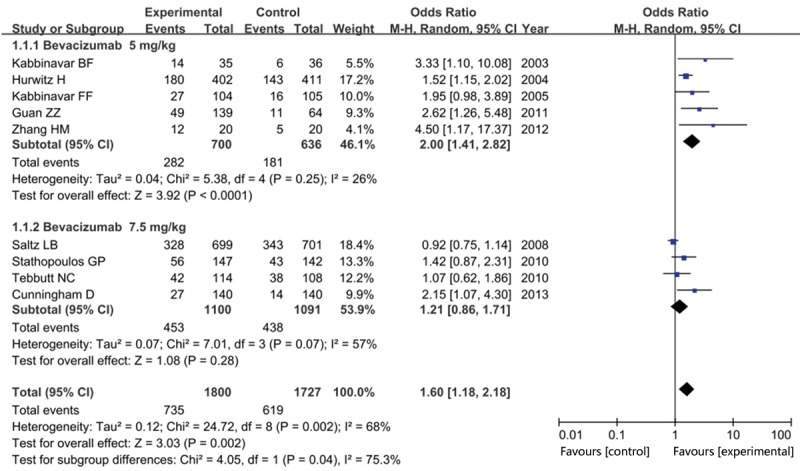
Forest plot of overall response rate in experiment group versus control group in subgroup analysis by bevacizumab dosage.
Official websites use .gov
A
.gov website belongs to an official
government organization in the United States.
Secure .gov websites use HTTPS
A lock (
) or https:// means you've safely
connected to the .gov website. Share sensitive
information only on official, secure websites.
Forest plot of overall response rate in experiment group versus control group in subgroup analysis by bevacizumab dosage.