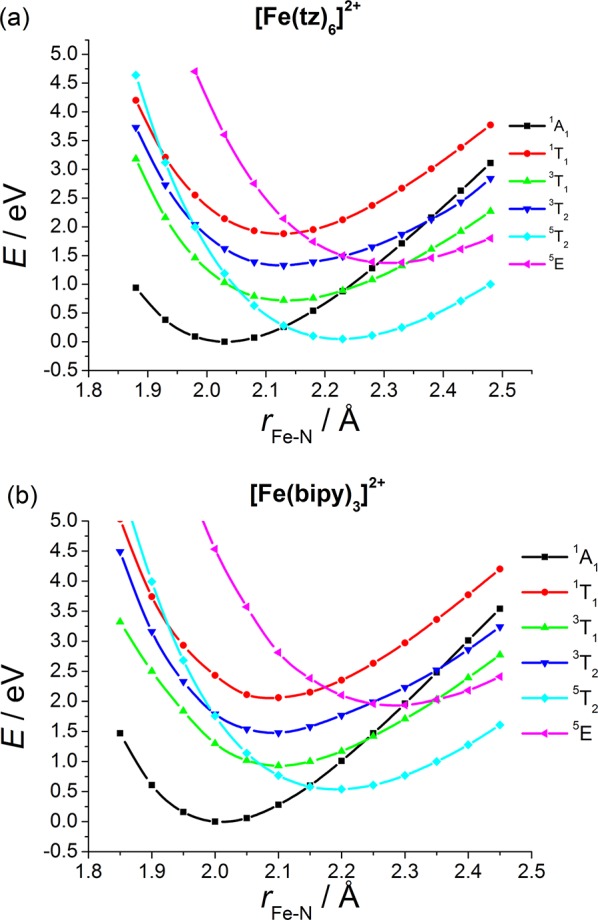
Figure 4.

TD-B3LYP*/TZVP calculated potential energy curves for (a) [Fe(tz)6]2+ (1) and (b) [Fe(bipy)3]2+ (2). The zero value of the energy scale is set to the minimum of the 1A1 potential. The 3T1 state was computed by a triplet SCF calculation, while the 3T2 state was calculated with the TD-DFT method, using the 3T1 reference state, as described in the text. This figure is to be compared with Figure 3 in ref (32) and Figure 3 in ref (33).
