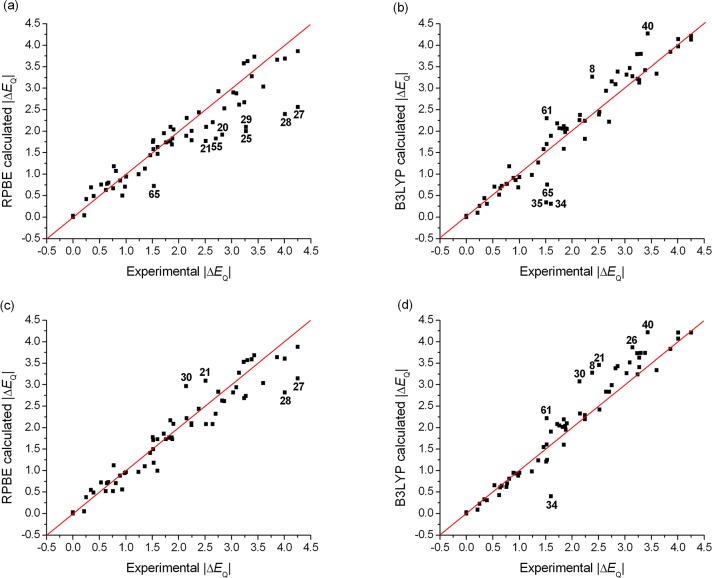
Figure 3.
Comparison of experimental and (a) RPBE, (b) B3LYP, (c) COSMO-RPBE, (d) COSMO-B3LYP (in combination with the GTO-CP(PPP) basis set) calculated quadrupole splittings (ΔEQ). The red line connects the ΔEQ(exp.) = ΔEQ(calc.) points. The largest outliers can be identified by the numbers defined in Table 1. Correlations for all the other applied DFT methods are shown in the SI.

