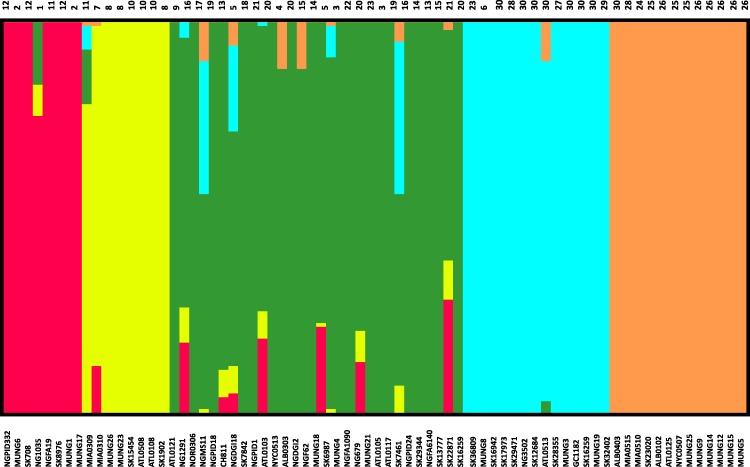
Figure 3. Population subgroups from strains of N. gonorrhoeae in the sample set defined by BAPS.
The names for each strain in the different subgroup are indicated at the bottom of the plot on the x-axis, while the fineSTRUCTURE group labels for each strain is indicated on top of the plot. This figure shows that the structure of the Neisseria gonorrhoeae population divides into five subgroups. Each color represents one of the genetically differentiated groups and each vertical colored bar corresponds to one isolate. When the vertical bars show two colors, each color corresponds to one of the groups and this is evidence for admixture; the proportion of every color in the bar reflects the proportion of the genome coming from the group represented by that particular color.

