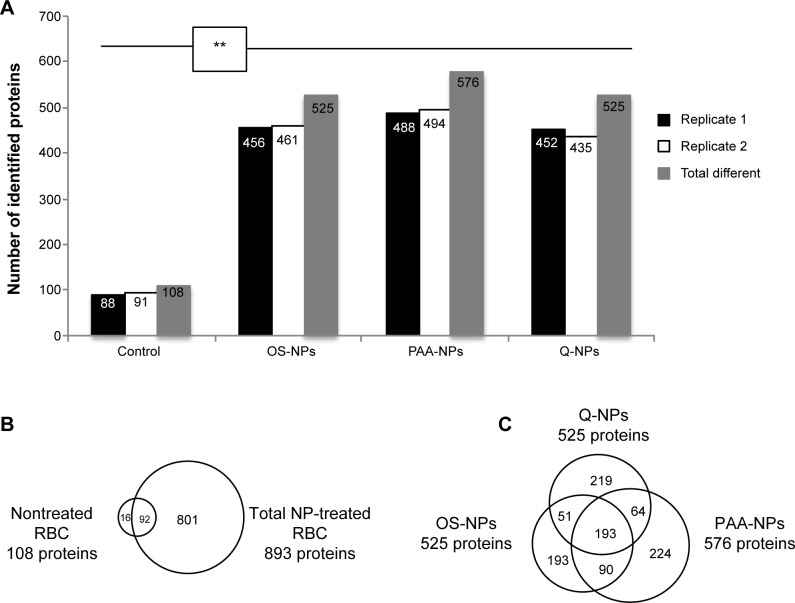
Figure 2.
Protein identification results and NP comparison.
Notes: (A) Graphical representation of the number of identified proteins by nano-LC–MS/MS in each replicate, in nontreated and NP-treated RBC lysates. “Total different” columns represent the total number of identified proteins in each condition after merging both replicates. (B and C) Venn diagrams representing the extent of overlap of proteins identified by LC–MS/MS analysis. (B) Comparison made between the nontreated RBC extract (108 proteins) and all NP-treated samples (894 proteins). (C) Comparison among the three NP-treated samples (PAA-NP, 576 proteins; OS-NP, 525 proteins; Q-NP, 525 proteins). The number of identified proteins in NP samples is significantly higher than in nontreated samples (Mann–Whitney test P=0.009).
Abbreviations: LC–MS/MS, liquid chromatography–tandem mass spectrometry; NP, nanoparticle; RBC, red blood cell.

