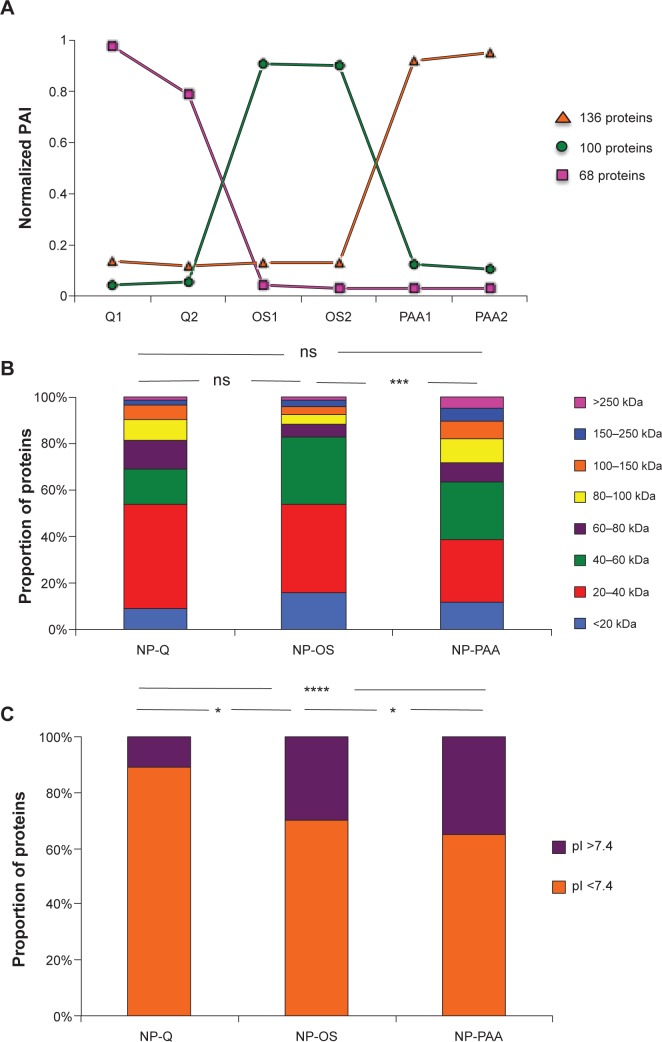
Figure 4.
Characterization and comparison of protein groups specific to NP surface by quantitative mass spectrometry.
Notes: (A) Graphical representation of the mean normalized PAI value of three protein groups (obtained by hierarchical clustering) specific to NP surface. Here, 136, 100, and 68 proteins are preferentially captured by PAA-NPs, OS-NPs, and Q-NPs, respectively. Histogram representing (B) the MW and (C) the pI of these specific proteins for each NP surface. *P<0.05; ***P<0.001; ****P<0.0001.
Abbreviations: NP, nanoparticle; PAI, protein abundance index; MW, molecular weight; pI, isoelectric point; ns, non significant.

