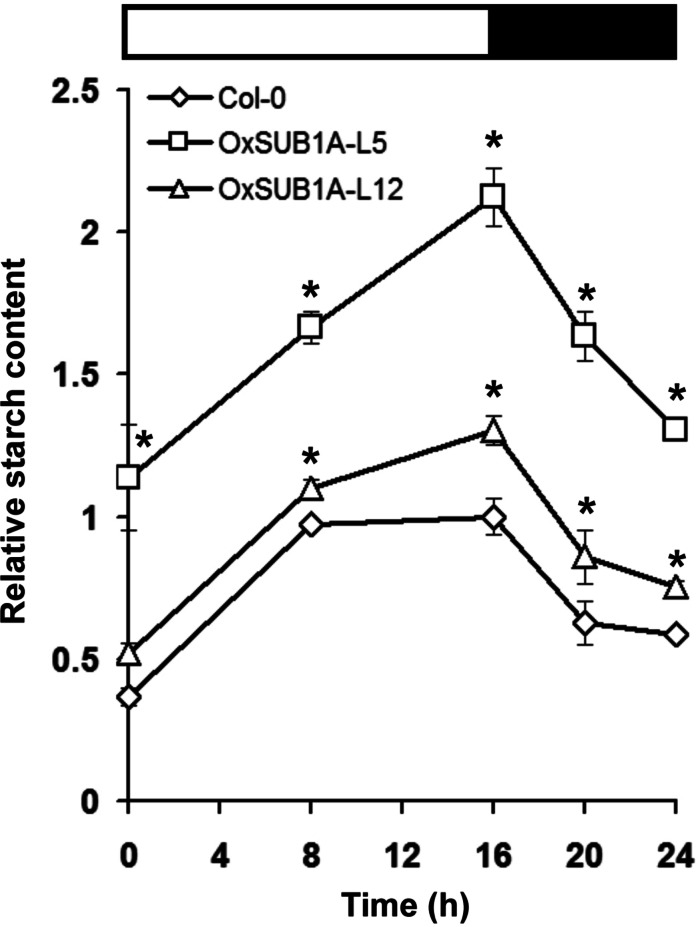
Figure 3. Diurnal oscillation of starch content of 21-day-old Arabidopsis plants expressing rice SUB1A-1.
Upper bar indicates day (open) and night (black) time (16 h day/8 h night). Asterisks indicate a significant difference between genotypes (P < 0.05, Student’s t test). Data were normalized to Col-0 maximum value at the end of the day ZT16 (9.4 mg of glucose g−1 FW). Values are means of three independent experimental replicates, each with n = 5 plants. Error bars are ±S.E.

