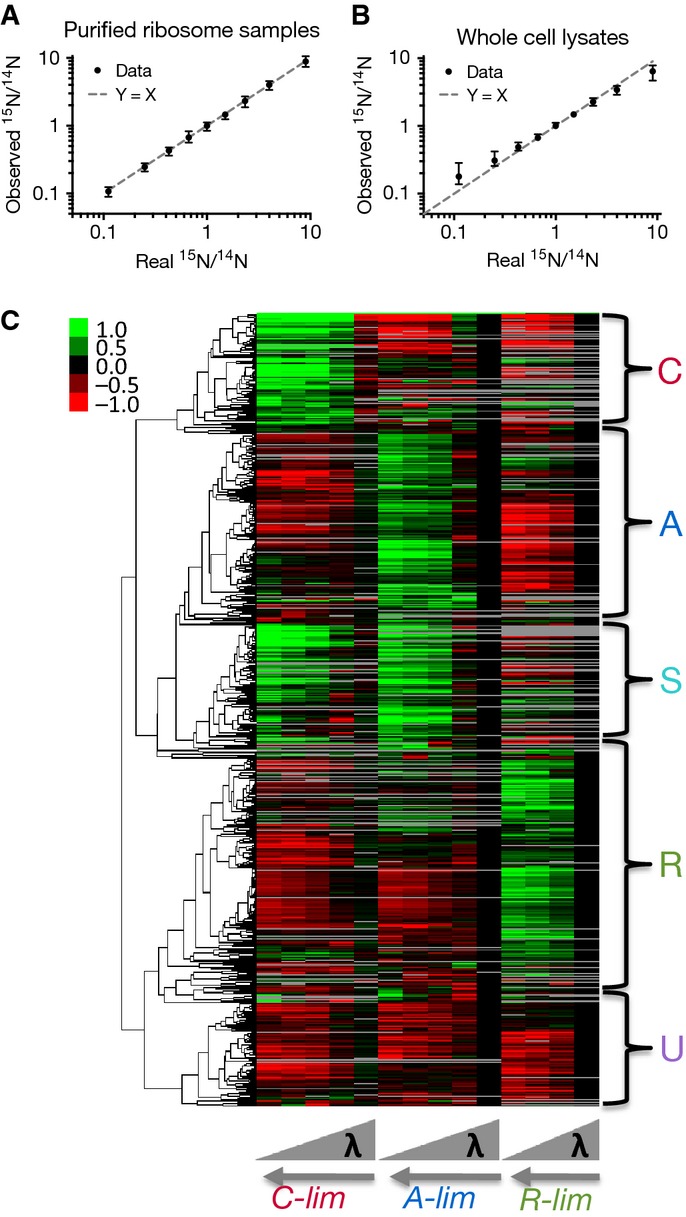
C The expression matrix and clustering results. The matrix is composed of 1,053 proteins (rows) and 14 conditions (columns); see
Supplementary Table S2. The first five columns are for C-limitation, the next five columns for A-limitation, and the last four columns for R-limitation. For each mode of growth limitation, the growth rate increases from left to right. The matrix is log2-transformed, with expression values at the standard condition as zero (see Materials and Methods), represented as black color. Red color indicates negative values, green color positive values, and gray color missing entries. A dendrogram generated by clustering analysis is shown on the left of the expression matrix (see Materials and Methods), with the five major clusters shown on the right side of the matrix. The data are estimated to cover ˜80% of the proteome; see
Supplementary Fig S5.

