
Figure 5. Performance of the proteome-based flux model.
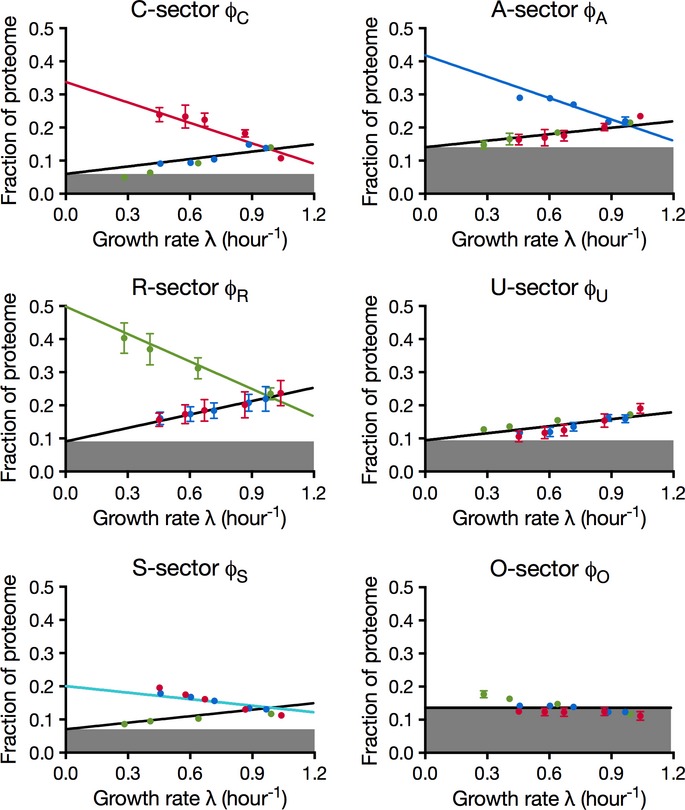
The data points are identical to those in Fig3. The lines here are the result of a global fit to the predictions of the flux-based proteome model (Supplementary Table S6). The growth rate-independent component of each sector (φσ,0) is represented as the height of the filled area in the corresponding plot. See Supplementary Table S7 for parameters of the fitted lines.