
Figure 1. Construction of a cell-based system for elucidating the PYHIN family protein interaction network.
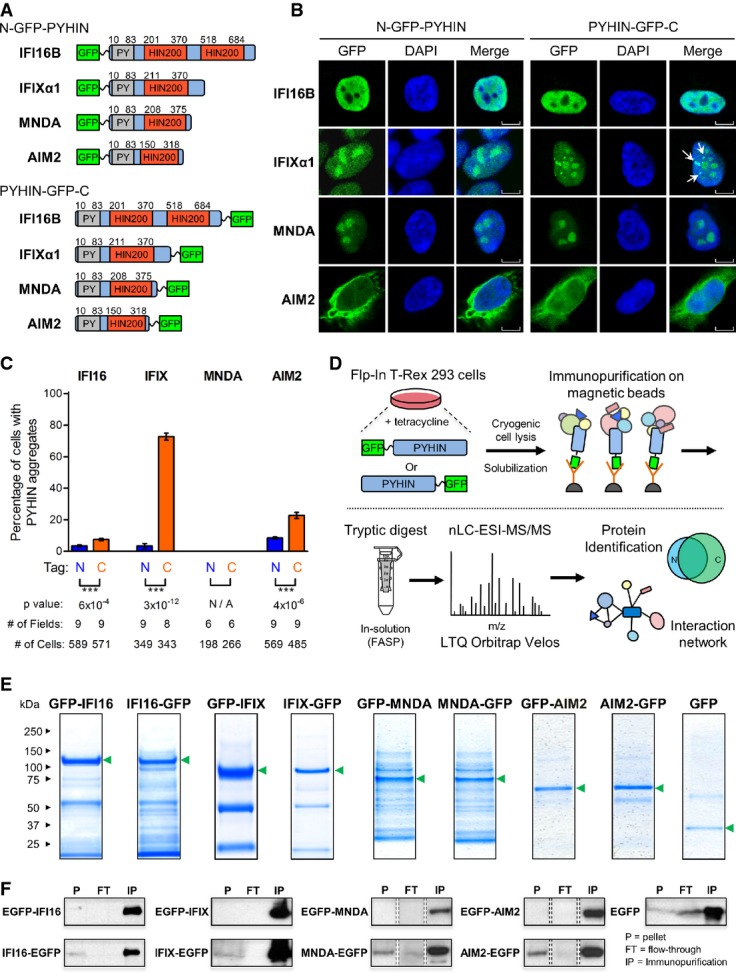
- A PYHIN proteins were tagged with GFP at either the N-terminus, adjacent to the pyrin domain (gray), or the C-terminus, adjacent to the HIN200 domain (red).
- B The localization of all eight PYHIN-GFP constructs within their respective inducible HEK293 cell lines was visualized by fluorescence confocal microscopy. Punctate structures are indicated by white arrows. Scale bars, 5 μm.
- C The percentages of cells displaying PYHIN-GFP punctate structures were determined for all PYHIN-GFP HEK293 cell lines using fluorescence confocal microscopy. The number of cells and fields of view are indicated. Mean values ± SEM (n varies). ***P ≤ 0.001, comparing N- and C-terminally tagged constructs (Student's unpaired t-test; two-tailed).
- D Proteomic workflow for mapping the protein interaction network of GFP-tagged PYHIN proteins. Specificity of PYHIN–prey interactions was assessed by label-free AP-MS and SAINT.
- E PYHIN-GFP and GFP immunoisolates were resolved by SDS–PAGE and Coomassie staining. PYHIN-GFP baits are indicated (green arrows).
- F Pellet (P), flow-through (FT), and immunopurified (IP) fractions from PYHIN-GFP immunoisolations were assessed by Western blotting to determine isolation efficiency of PYHIN targets. Protein bands represent 1% loading of each indicated fraction.