
Figure 7.
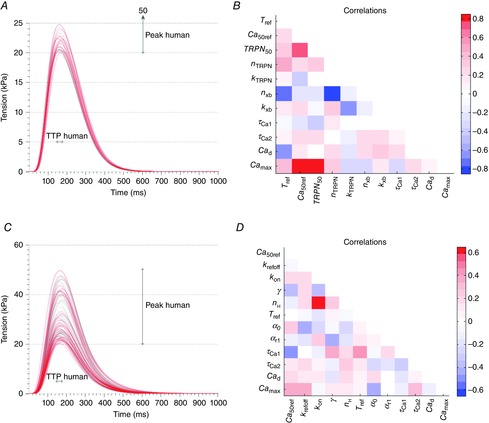
Results from parameter fitting to data for human
A and B, tension transients (A) and parameter correlation patterns (B) for the Land model simulations giving human output metric values. C and D, tension transients (C) and parameter correlation patterns (D) for the Niederer model simulations giving human output metric values. The grey lines represent the parameter sets found using the Beuckelmann Ca transient shown in Fig. 3C, while the red lines represent the parameter sets found when the Ca transient parameters were varied according to the ranges in Table5.