
Figure 9.
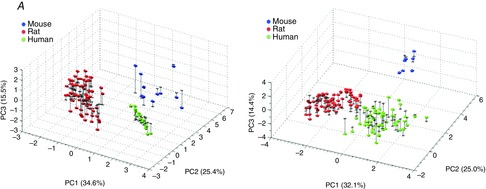
Maps of inter-species differences in the model parameter spaces
PCA-based maps of the parameter spaces of the Land model (A) and the Niederer model (B). The three first PCs from a PCA of the parameter sets found to replicate measured data for mouse, rat and human, respectively, are shown. The percentage explained variance by each PC is shown in parentheses. The lines illustrate the distance from the different points to the plane spanned by PC1 and PC2.