Figure 3.

Expression and subcellular localization of native Kir channel in FDB muscles
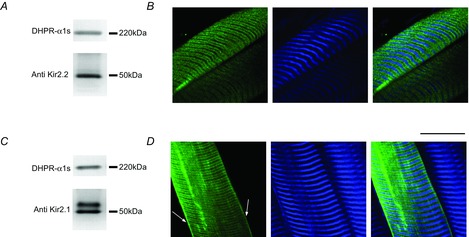
A and C, Western blot analysis of Kir2.2 and Kir2.1 expression, respectively. The dihydropyridine receptor was used as a loading control. B and D, TPLSM analysis of the targeting of Kir2.2 and Kir2.1, respectively. For both sets of data, panels 1 and 2 are the images of the fluorescence of the secondary antibodies and the corresponding backscattered second harmonic generation signal, respectively. The overlay of equivalent images is shown in the corresponding panel 3. Arrows indicate surface expression of Kir2.1.
