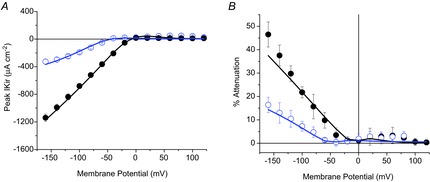
Figure 8.

Simultaneous model prediction of peak IKir and optical attenuation for two extracellular [K+]
A, model predictions (continuous lines) of the experimental peak IKir (symbols) recorded in a fibre exposed to 96 mm (filled circles) and 24 mm (open circles) [K+]o. B, model predictions (continuous lines) of the percentage peak attenuation, calculated from the same fibres as in A (symbols and error bars). PKir = 5.5 × 10⁻⁶ cm s−1; S/TTS = 1.
