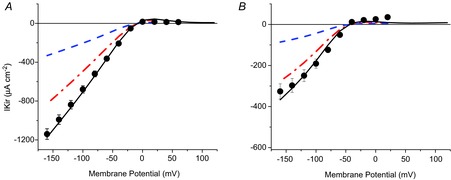
Figure 9.

Model simulation of the IKir arising from the surface and TTS membranes
A, model predictions (continuous lines) of the total peak IKir (symbols and error bars) of fibres exposed to 96 mm [K+]o. The predicted IKir contributions from the TTS and surface membranes are represented by the dash-dot and dashed lines, respectively. B, as for A, but for 24 mm [K+]o. PKir = 7.5 × 10⁻⁶ cm s−1; S/TTS = 1.
