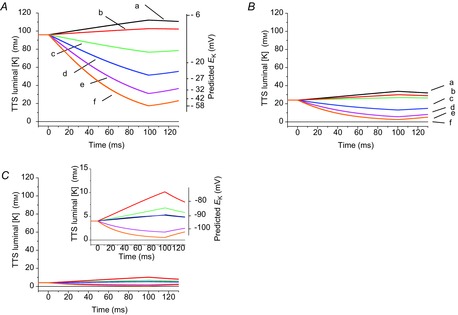
Figure 11.

IKir activation leads to reductions in the TTS luminal [K+]
A, model predictions of TTS luminal [K+] changes (left ordinate axis) in response to pulses to +20, 0, −40, −80, −120 and −160 mV (traces a–f, respectively) in a fibre exposed to a bulk [K+]o = 96 mm. The right ordinate axis shows the predicted EK from the TTS luminal [K+]. B, luminal [K+] changes for the same fibre in 24 mm [K+]o. Pulses to the same values as in A were used. C, luminal [K+] changes in response to the same values as in A, but predicted for a fibre exposed to 4 mm [K+]o. The traces are shown in a narrower [K+] scale in the inset, which also includes the predicted values for EK. PKir = 5.5 × 10⁻⁶ cm s−1; S/TTS = 1. In all panels the solid horizontal lines indicate the luminal [K+] prior to pulse application (equal to bulk [K+]o).
