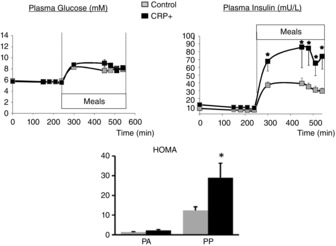
Figure 2.

Glycaemia, insulinaemia and HOMA-IR index during the metabolic study
Data are the mean ± SEM; n = 10 for control group and n = 6 for CRP+ group. For statistical evaluation of data, a repeated-measures mixed model was run followed by Tukey–Kramer tests for glucose and insulin and a non-parametric procedure followed by the Mann–Whitney test for HOMA-IR *P < 0.05 vs. control group.
