Figure 1.

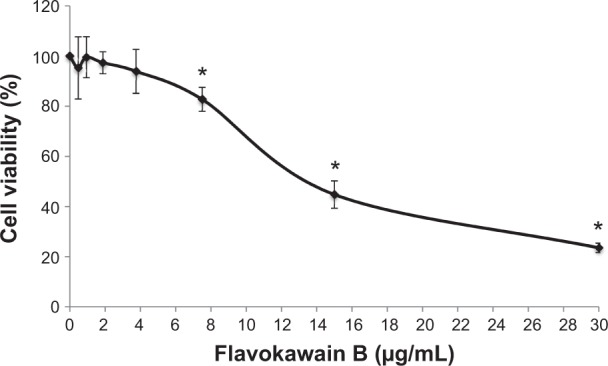
MTT analysis on 4T1 cells after treatment with seven different concentrations of flavokawain B for 72 hours.
Notes: All values are represented as mean ± standard error of the mean; n=3 biological replicates of 4T1 cells. *P<0.05.

MTT analysis on 4T1 cells after treatment with seven different concentrations of flavokawain B for 72 hours.
Notes: All values are represented as mean ± standard error of the mean; n=3 biological replicates of 4T1 cells. *P<0.05.