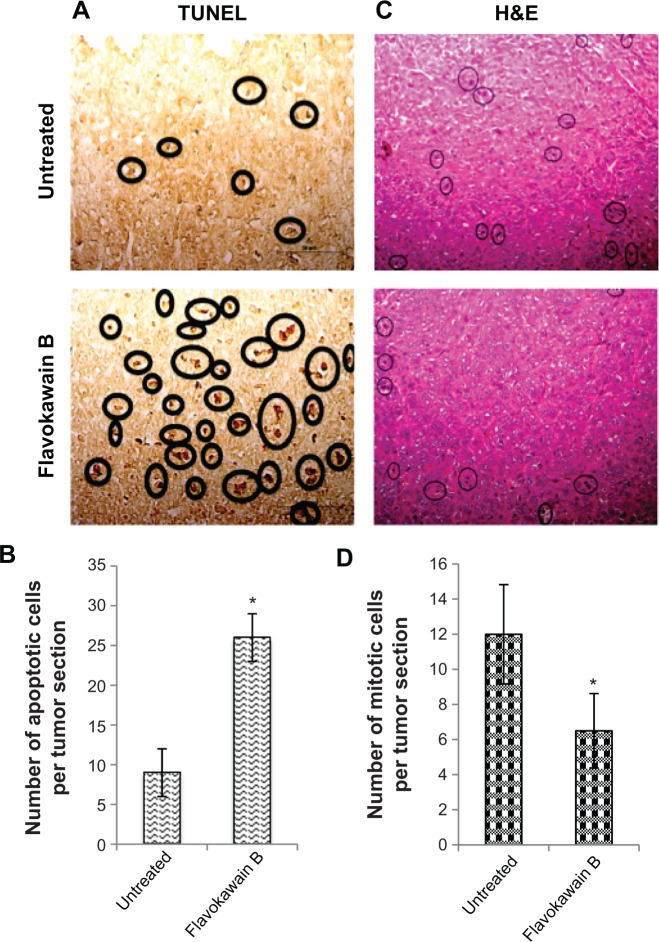
Figure 5.
Terminal deoxynucleotidyl transferase dUTP nick end labeling (TUNEL) analysis of tumors harvested from both control mice as well as flavokawain B (50 mg/kg)-treated mice (A), and quantified (B). Histological staining of both the tumors (control and flavokawain B-treated) with hematoxylin and eosin (H&E) (C), and quantified (D).
Notes: (A) Black circles represent cells with fragmented DNA (apoptotic cells). Magnification, 40×. (C) Circles represent cells undergoing mitoses. Magnification: 20×. *Significance is set at P<0.05, and each value represents mean ± standard error of the mean; n=7 mice per group.

