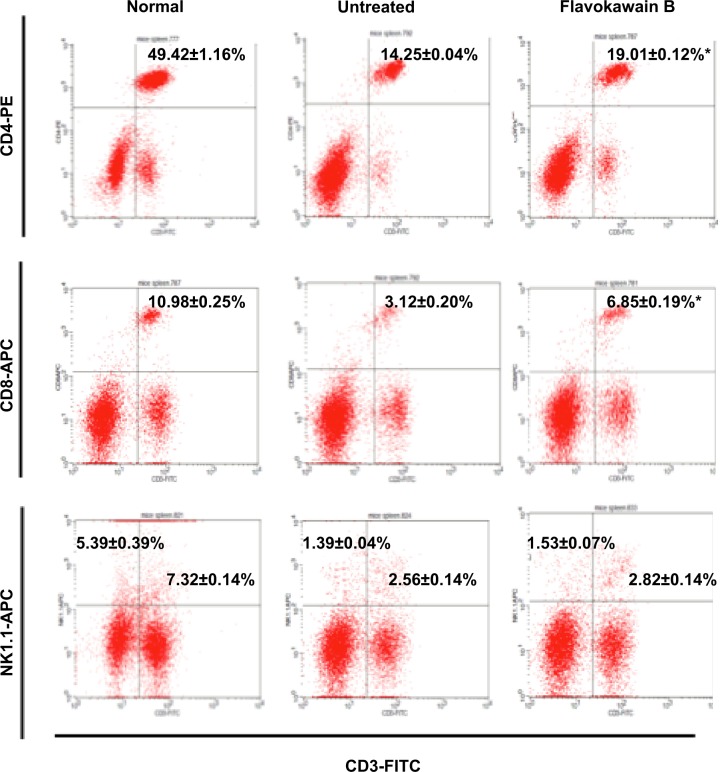
Figure 6.
Flow cytometry analysis of four immune markers (CD3, CD4, CD8, and NK1.1) on the splenocytes of both the control and flavokawain B (50 mg/kg)-treated mice.
Notes: Each value represents the mean ± standard error of the mean for triplicates. Significance is set at *P<0.05; n=7 mice per group.

