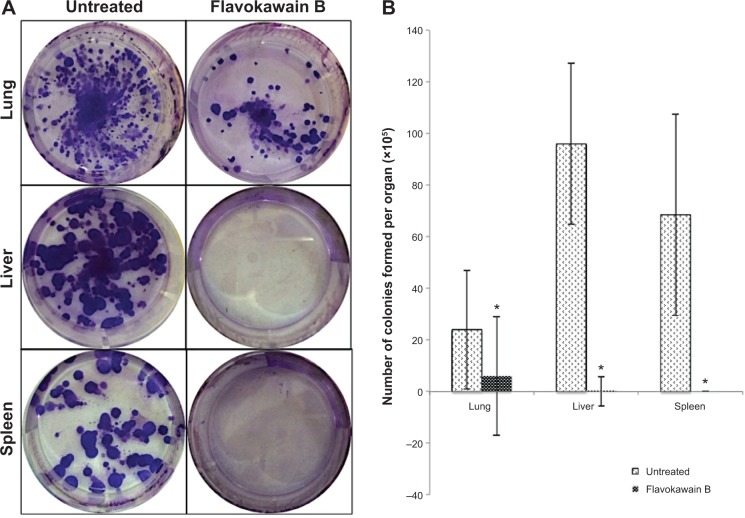
Figure 8.
Representative images of the colonies formed in each of the organs (A). Bar chart of the total 4T1 colonies formed from the meshed lung, liver, and spleen harvested from the control and flavokawain B (50 mg/kg)-treated mice after 10 days of incubation (B).
Notes: (A) Lung, dilution factor: 104; liver, dilution factor: 104; spleen, dilution factor: 105. (B) Each value represents mean ± standard error of the mean; *P<0.05; n=3.

