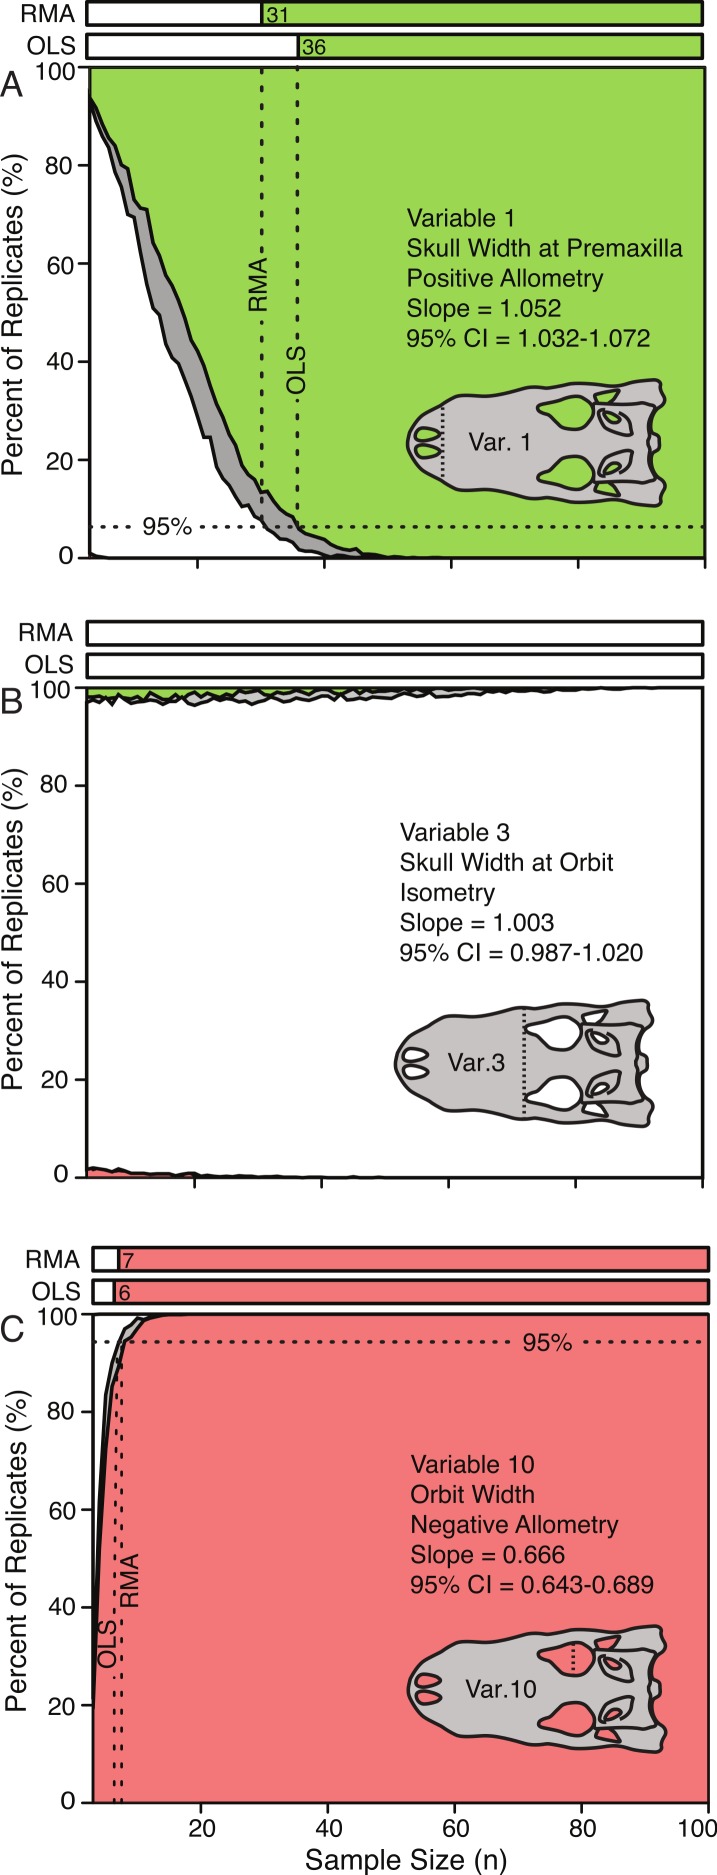
Figure 5. Allometric power plots illustrating the effect of sample size (random subsample) on the scaling trend of three representative variables.
Variable 1, positively allometric (A); Variable 3, isometric (B); Variable 10, strongly negatively allometric (C). In all cases, white indicates isometry, green indicates positive allometry, red represents negative allometry, and grey indicated disagreement between OLS and RMA. The bars at the top represent the minimum sample size needed to achieve the same scaling trend as the entire dataset. For all variables see Fig. S2.

