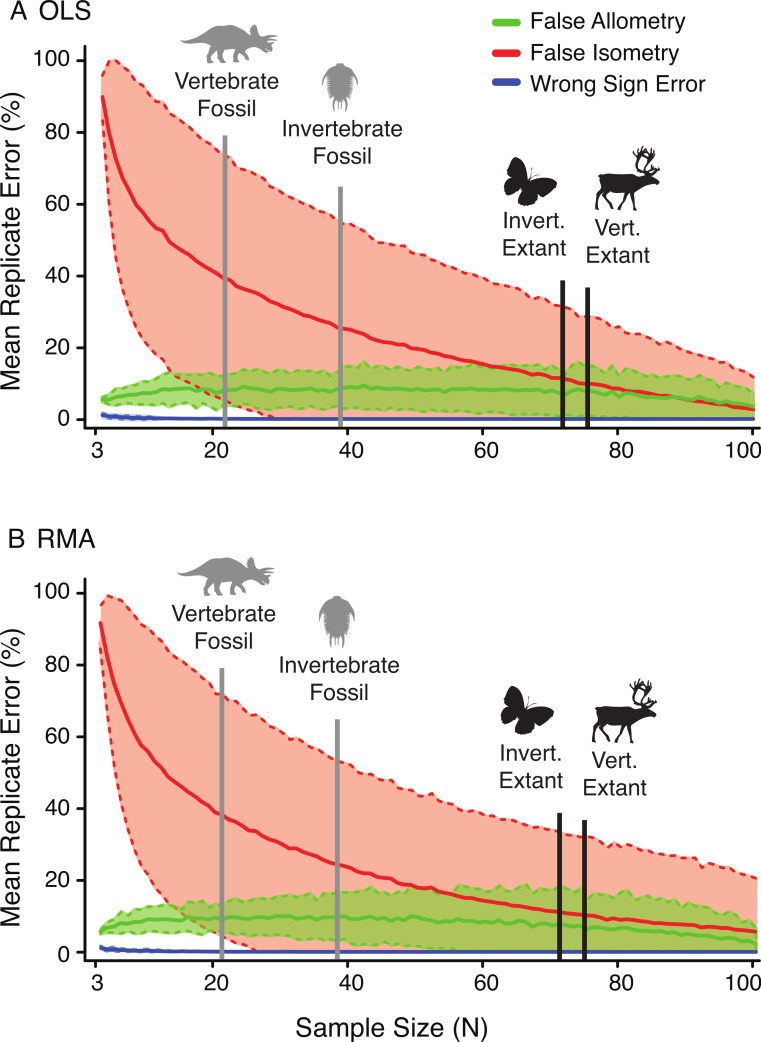
Figure 7. The effect of sample size on the frequency of false allometry (‘Type I error’) (green), false isometry (‘Type II error’) (red), and wrong sign error (blue) in the random subsample replicates of A. mississippiensis for OLS (A) and RMA (B).
Solid lines represent the mean of all 22 variable replicates and dotted lines represent one standard deviation of all 22 variable replicates (derived from the Alligator subsampling). For relative comparison, the mean sample sizes for the literature review of allometric studies of fossil and extant, (and vertebrae and invertebrate) allometric studies are indicated with the vertical bars.

