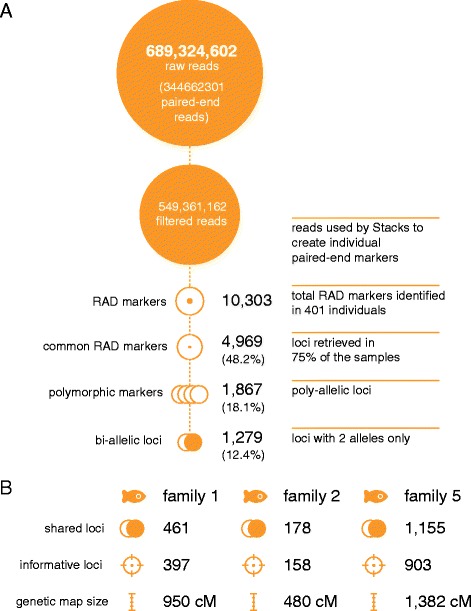
Figure 1.

Sequencing and polymorphic marker summary. (A) Details of the number of reads before and after filters (orange disk) followed by the reconstructed number of RAD markers and polymorphic RAD markers (orange circles). (B) Genetic map reconstruction. Number of shared polymorphic markers within each family, the number of informative loci and final genetic map size.
