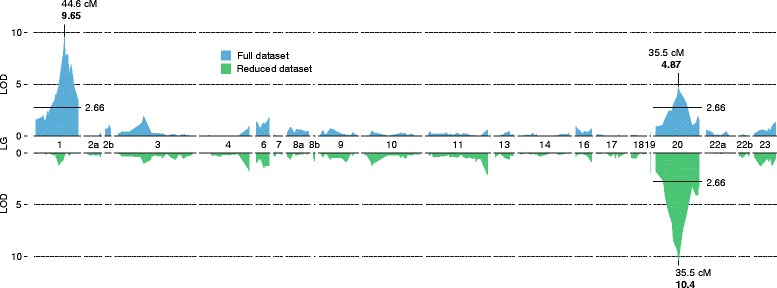
Figure 2.

QTL mapping in family 1. Plots of the LOD score (sex-determining QTL search) along the linkage groups. Top graph, full dataset; bottom graph, reduced dataset (44 females and 21 males suspected to have undergone sex reversal). The numbers refer the linkage group numbers Table 3.
