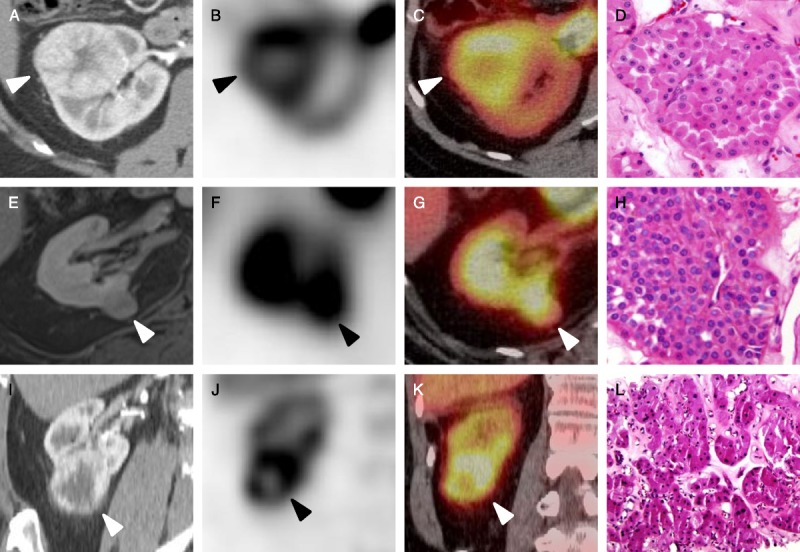
FIGURE 3.

Representative images of the oncocytomas included in this study. A, Axial contrast-enhanced CT, axial SPECT (B), and axial SPECT/CT fusion images of a right upper pole oncocytoma (C) with a representative histologic image (D, hematoxylin and eosin stain [HE] ×20) (patient 1, white and black arrowheads). E, Axial contrast-enhanced T1-weighted MRI, axial SPECT (F), and axial SPECT/CT fusion images of a right medial interpolar oncocytoma (G) with an accompanying histologic image (H, HE ×20) (patient 2, white and black arrowheads). I, Coronal contrast-enhanced CT, coronal SPECT (J), and coronal SPECT/CT fusion images of a right lower pole oncocytoma (K) with a corresponding histologic image (L, HE ×20) (patient 3, white and black arrowheads).
