
Figure 8j.
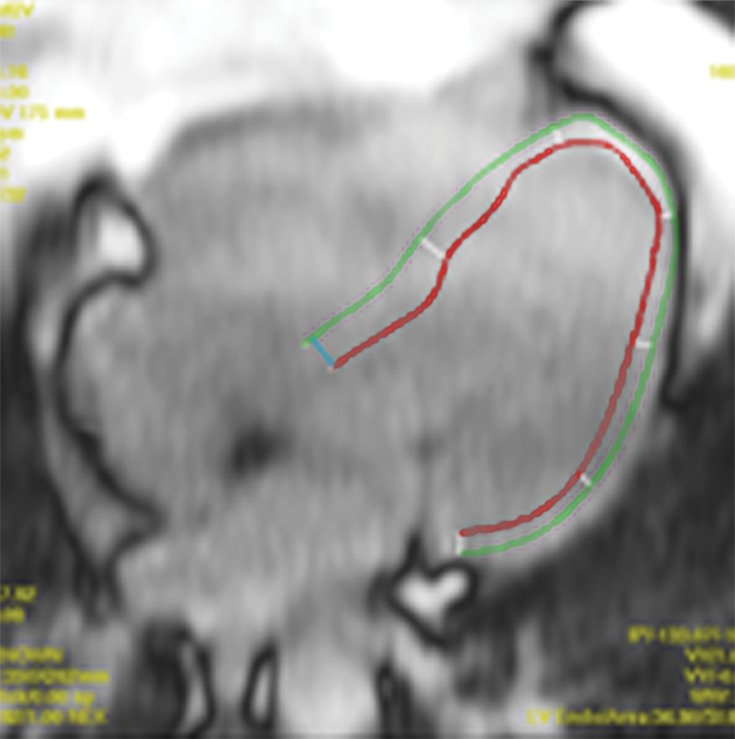
T1 mapping performed with LL and MOLLI sequences in a 42-year-old man with mild asymmetric septal hypertrophy and mild to moderate systolic anterior motion of the mitral valve with provocation at echocardiography and a family history of hypertrophic cardiomyopathy. (a–d) Bright blood MR images obtained in the horizontal long-axis plane (a), vertical long-axis plane (b), five-chamber view (c), and short-axis plane (d) show that mid septal thickness reaches 1.3 cm in end diastole. (e–h) Short-axis myocardial delayed enhancement MR images show an absence of late contrast enhancement. (i, j) Postcontrast T1 mapping performed with an LL sequence in the horizontal long-axis plane shows the left ventricular endo- (red line) and epicardial (green line) contours, which are manually drawn. Thirty-two images were acquired throughout the cardiac cycle. (k) Graph shows the data obtained from LL T1 mapping, which were plotted with three-parameter curve fitting and used to calculate T1 times. x-axis = delay time, y-axis = signal intensity. (l, m) Postcontrast T1 mapping performed with a MOLLI sequence in the short-axis plane shows the left ventricular endo- (red line) and epicardial (green line) contours, which are manually drawn. All 11 images were acquired at the same time in end diastole. (n) Graph shows the data obtained from MOLLI T1 mapping, which were plotted with three-parameter curve fitting and used to calculate T1 times. MOLLI and LL sequences had similar T1 values for T1 times after administration of gadolinium contrast material. x-axis = delay time, y-axis = signal intensity.