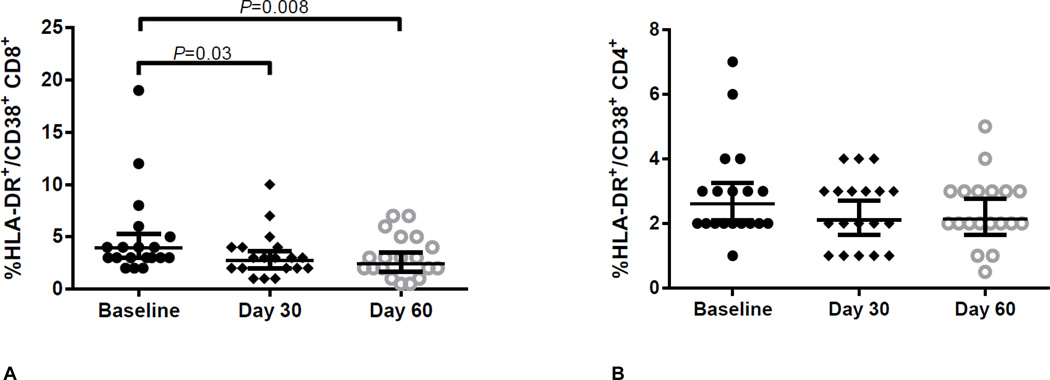
Figure 1.
CD8+ T-cell (Panel A) and CD4+ T-cell (Panel B) immune activation (CD38/HLA-DR co-expression) at baseline (before drug), day 30 (after 30 days of TDF/FTC) and day 60 (30 days of washout). CD8+ T-cell ANOVA P=0.02. CD4+ T-cell ANOVA P=0.25. Bars and error bars represent geometric means and 95% confidence intervals, respectively. Statistical tests were conducted on loge transformed data. Abbreviations: TDF/FTC, tenofovir-disoproxil-fumarate/emtricitabine.

