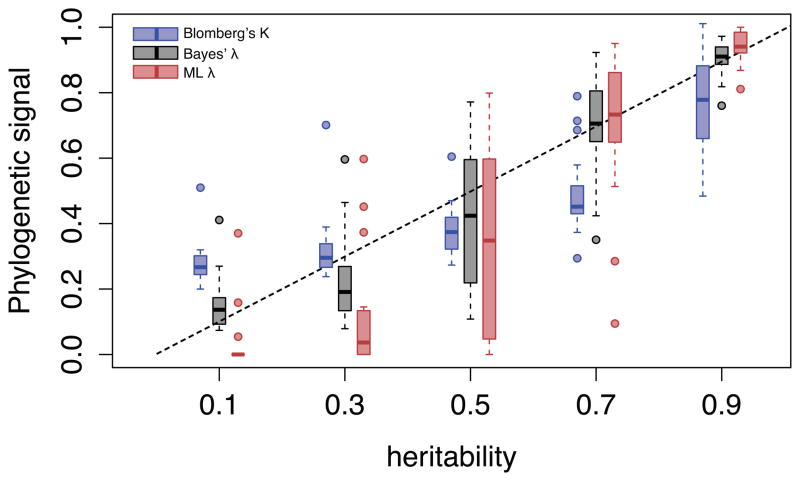
Figure 2. Estimator performance of Blomberg’sK, Pagel’s λML and λB on simulated data.
Twenty phylogenies are simulated to model the evolution of an infection trait with known heritability (h2 = 0.1, 0.3, 0.5, 0.7 & 0.9). Phylogenetic signal is then estimated on each tree using only 128 leaves to account for incomplete sampling. The box plots shows the median values, the three quartiles and the outliers for Blomberg’s K (blue), Pagel’s λB (red) and λB (grey).

