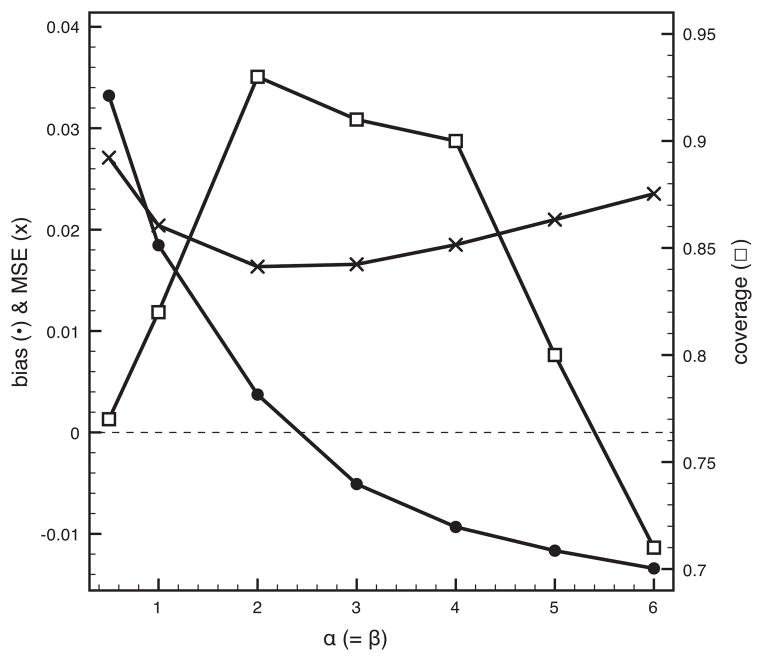
Figure 3. Performance of the Bayesian phylogenetic signal estimation under various priors on λB.
Different β(α,β) priors are explored for α = β. We plot bias (filled black circles) and MSE (crosses) according to the primary axis and coverage (open squares) according to the secondary axis. The dotted horizontal line represents zero bias and MSE.

