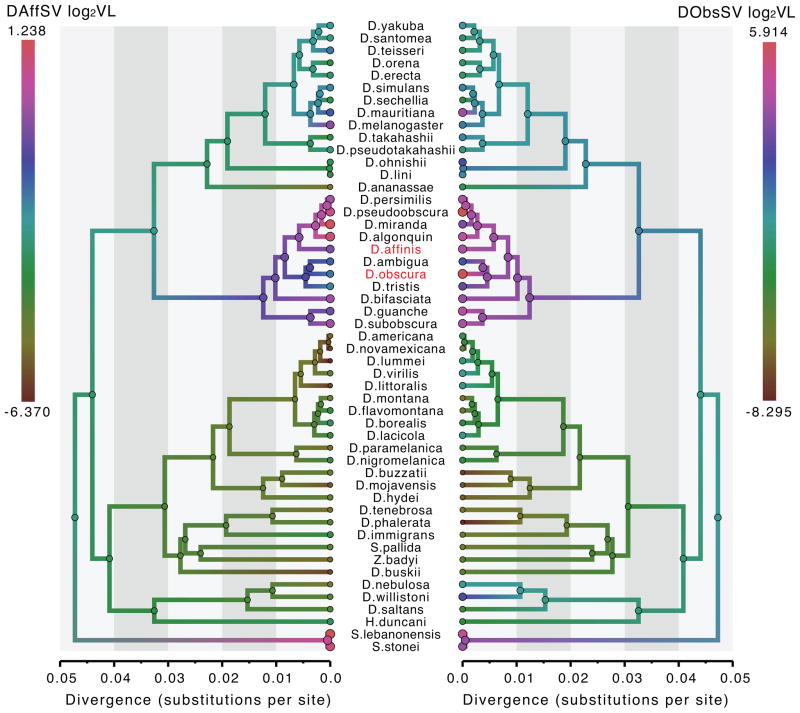
Figure 7. Drosophila evolutionary history with reconstructed susceptibility to infection with different host-specific sigma viruses.
The ancestral reconstruction of log2(VL) measurements for two host-specific viruses (DA3SV in D. affinis, left; DObsSV in D. obscura, right) are shown using a color gradient along the branches of the same MCC tree. Higher log2(VL) values reflect higher levels of viral replication; circles are proportional to these values.

