
Figure 3.
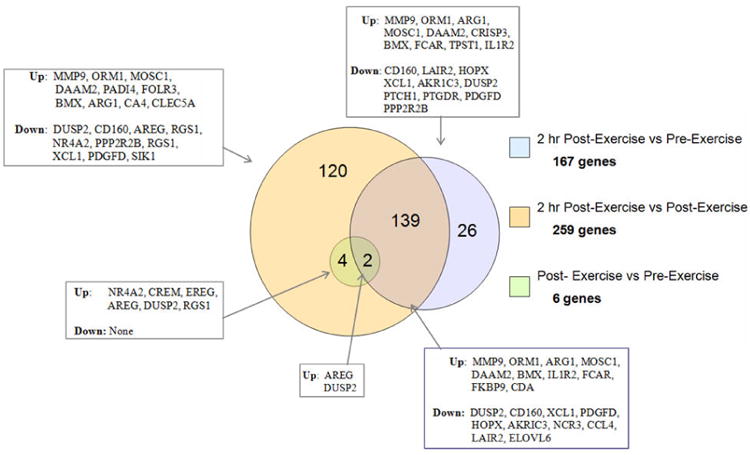
Venn Diagram showing the number and similarity of differentially detected genes from each comparison. These data indicate that 139 of the167 genes differentially detected between the 2 hr after exercise and pre-exercise were the same genes as those detected between 2hr after exercise vs immediate post exercise. All 6 genes detected for the immediate post exercise data vs pre exercise were also seen in the 2hr after exercise vs immediate post exercise.