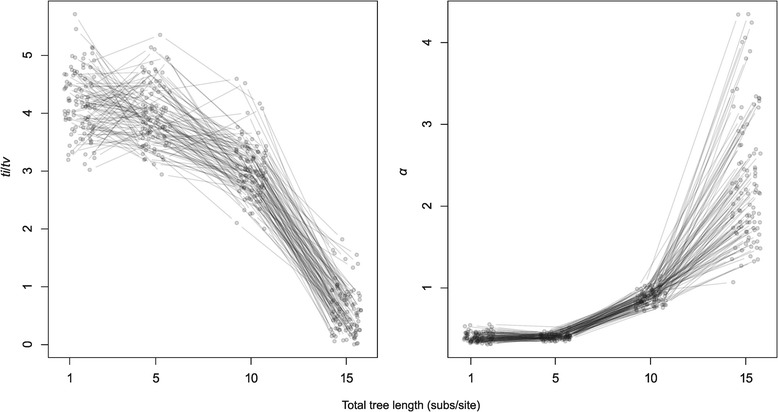
Figure 2.

Estimates of ti / tv and of the shape parameter, α , of the Γ-distribution of among-site rate variation plotted against total tree length (subs/site) for simulated data. Each line corresponds to a phylogenetic tree and the points are the maximum likelihood estimates for data simulated on trees with different lengths (x-axis). For clarity, the points have been jittered along the x-axis.
