
Fig. 1. Ex vivo expansion of breast cancer CTCs.
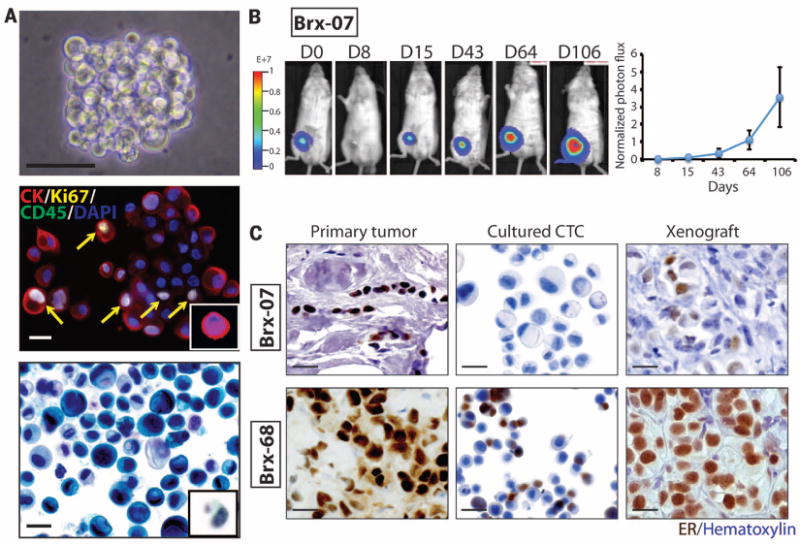
(A) Representative images of nonadherent CTC culture (BRx-07). Top: Phase contrast. Scale bar, 100 μm. Middle: immunofluorescent staining for cytokeratin (CK, red), Ki67 (yellow), CD45 (green), nuclei [4′,6-diamidino-2-phenylindole (DAPI), blue]. Scale bar, 20 μm. Bottom: Light microscopic imaging with Papanicolaou staining. Comparable images for uncultured primary CTCs are shown in the insets. Scale bar, 20 μm. (B) (Left) Bioluminescent images showing growth of NSG mouse xenografts, after implantation of 20,000 cultured CTCs (BRx-07) into the mammary fat pad. (Right) Quantification of bioluminescent signals for BRx-07–derived mouse xenografts (mean ± SD, n = 6). (C) Histology of matched primary breast tumors, cultured CTCs, and CTC-derived mouse xenografts for two CTC lines. All panels show cellular staining with hematoxylin (blue) and immunohistochemical staining for ER expression (brown). Scale bar, 20 μm.