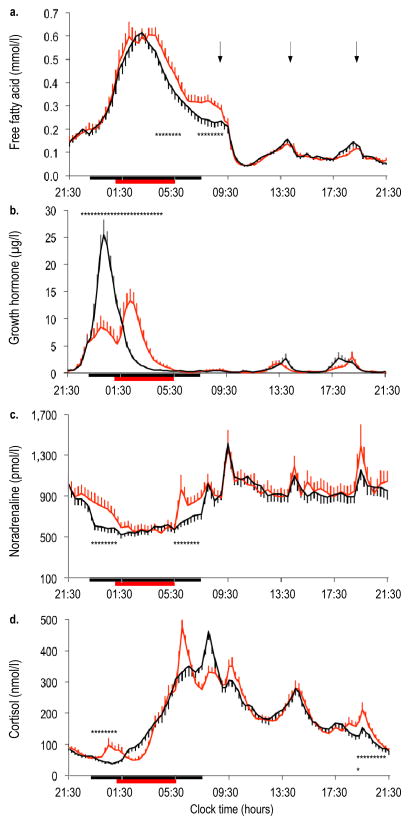
Fig. 2.
Twenty-four hour profiles of NEFA (a), GH (b), noradrenaline (c) and cortisol (d) under conditions of normal sleep (black lines) and sleep restriction (red lines) in N=19 participants. Error bars are SEM. Horizontal black bars, time in bed under normal sleep (23:00 to 07:30 hours); horizontal red bars, time in bed under sleep restriction (01:00 to 05:30 hours); arrows, identical meals served at 09:00, 14:00 and 19:00 hours. *p<0.05 for sleep restriction vs normal sleep at specific time points

