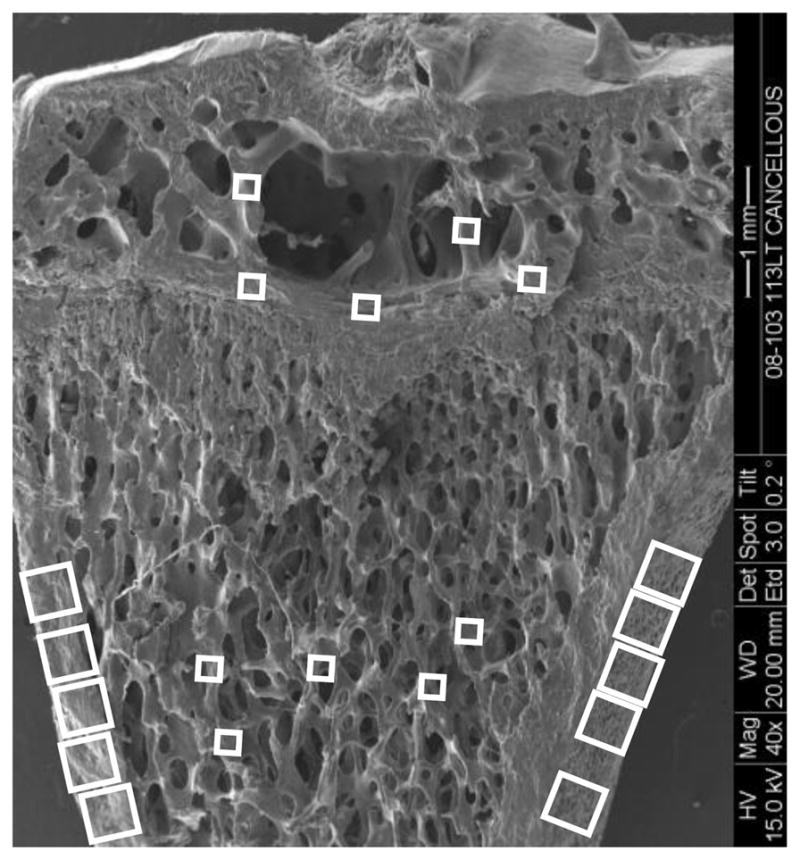
Figure 2.

Scanning electron microscopy image of a rat proximal tibia frontal section illustrating where the cortical and cancellous bone confocal images were taken to assess osteocyte lacunae labeled with injected tracer. For the metaphyseal region, five cancellous bone image samples (187.5 μm × 187.5 μm images, smaller boxes) were taken in the region spanning 1 to 3 mm distal to the growth plate; primary spongiosa were not included. Ten cortical metaphyseal image samples (375 μm × 375 μm images, larger boxes) were taken from the cortex region. For the epiphyseal region, three image samples were taken right above the growth plate, without including any region of the growth plate, to ensure consistency in sampling, and two additional regions of interest were sampled more proximally (187.5 μm × 187.5 μm images, smaller boxes).
